Safetipin works to make communities and cities safer by providing information and data collected through our different technology tools and apps. We collect and analyse data on several parameters that impact safety and play a role in creating inclusive spaces for a diverse set of people, with a focus on vulnerable groups, specially women.

We have data in over 50 cities in India and globally. Our vision is to become the acknowledged data provider of data for safe mobility. To this end, we work with city and municipal governments, UN, NGO’s and other stakeholders to map cities and provide recommendations for improvement.

Safetipin has several tools and services that can help urban stakeholders make cities and neighbourhoods safe and inclusive. We have three apps that can be used to collect data and also provide services for data analysis, data presentation, data integration and dashboards.

CITY WIDE SAFETY AUDIT

Using Safetipin Nite and My Safetipin apps, we collect data across the city through images and through user generated safety audits. We assess physical infrastructure as well as the social usage of streets and public spaces. Through these two methods, we are able to map the entire street network of a city as well as key public spaces such as transport hubs, parks, market etc. Once the data is collected, we assess and mark them both manually and through machine learning on parameters of safety, walkability, inclusion and other elements of urban spaces.  This provides a detailed mapping of urban spaces that can be used by different stakeholders.

CUSTOM SAFETY AUDIT

While the safety audit tool is very useful for measuring and assessing factors that affect the perception of safety, it is sometimes necessary to collect more in-depth and specific information on certain places or services to map safety. For this purpose, our app Safetipin Site allows a customer to give their specifications about exactly what kind of data they are interested in gathering and which places or sites are of key importance. This could be a whole neighbourhood, a specific place like public toilets or even something like last mile connectivity.  It has been done in Delhi to specifically map the last mile connectivity and in Durban, South Africa, it is going to be used to do safety audits of taxi ranks in the city.

PUBLIC SPACE IMPROVEMENT REPORTS

The data analysis is then used to generate different products such as reports, maps, csv files and recommendations. Maps are useful for giving an overview of key issues and safety elements in the city. The CSV files are given so that this data can be seen on a GIS platform and can be correlated with other data layers that the city might have. We have provided this service to several municipal and city governments including Delhi, New Delhi Municipal Council, cities in Haryana, Kolkata in India. We have also worked with cities in other countries including Bogota (Colombia, Hanoi (Vietnam) and Manila (Philippines) among others.  We are also able to build dashboards which governments can use to measure change and impact.

SAFETY SCORE AND API’S FOR PORTALS AND BUSINESSES

If your business helps customers make choices about a place, where to stay, live or visit, you can be more relevant with the Safetipin Safety Score data. This could be for hotels, properties, restaurants, paying guest accommodations among others. We provide a set of APIs, that allows you to provide your customers with the safety rating of the area, so your customers can make better decisions for their safety and comfort.

MY SAFETIPIN APP

My Safetipin is a personal safety app that helps you make safer decisions about your mobility, based on the safety score of an area. The app is free for all and uses crowd-sourcing to collect data. At the core of the app, we have the Safety Audit which is a tool to analyse a given area based on the physical and social infrastructure parameters. A user can contribute to a better understanding of their city by doing a Safety Audit through the app.


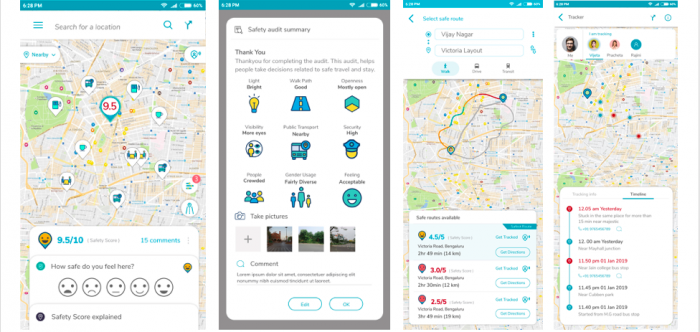
There are 9 parameters and based on the ratings given to these parameters, a safety score is created. The parameters which are a part of the audit are:

Lighting – Availability of enough light to see all around you

Openness – Ability to see and move in all directions

Visibility – Vendors, shops, building entrances, windows and balconies from where you can be seen

People – Number of people around you

Security – Presence of police or security guards

Walk Path – Either a pavement or road with space to walk

Public Transport – Availability of public transport like metro, buses, autos, rickshaws

Gender Usage – Presence of women and children near you

Feeling – How safe do you feel


The My Safetipin app has many other features too.

Tracking– If you are traveling alone and are feeling unsafe, you can send a tracking request to a friend or loved one and they can see your exact location. The person tracking will also get notifications if you are in an unsafe area (based on our data), if you have been stationary for an extended period of time or if you divert from your selected route. The tracking feature gives all control to the user and they can choose when to be tracked and when not.

Nearby Places
There are many times when you may be waiting for a cab or for someone to pick you up but the street where you’re waiting is unsafe and makes you feel uncomfortable. You can check out the Nearby Places feature on the app and find the restaurants, hospitals, markets etc., near you so that you can wait in peace.

Safest Route– All navigation apps show you the fastest route from one place to the other, however, sometimes these routes take you through extremely narrow areas
in order to avoid traffic and congestion. Use our Safest Route feature to get the safest route (based on our data) from one place to another. You will get options for the routes based on safety and you can select whichever is ideal for you. The control then shifts to google maps and you can navigate your way around with ease

Subscribe!

Join our mailing list for regular updates.