Methodology
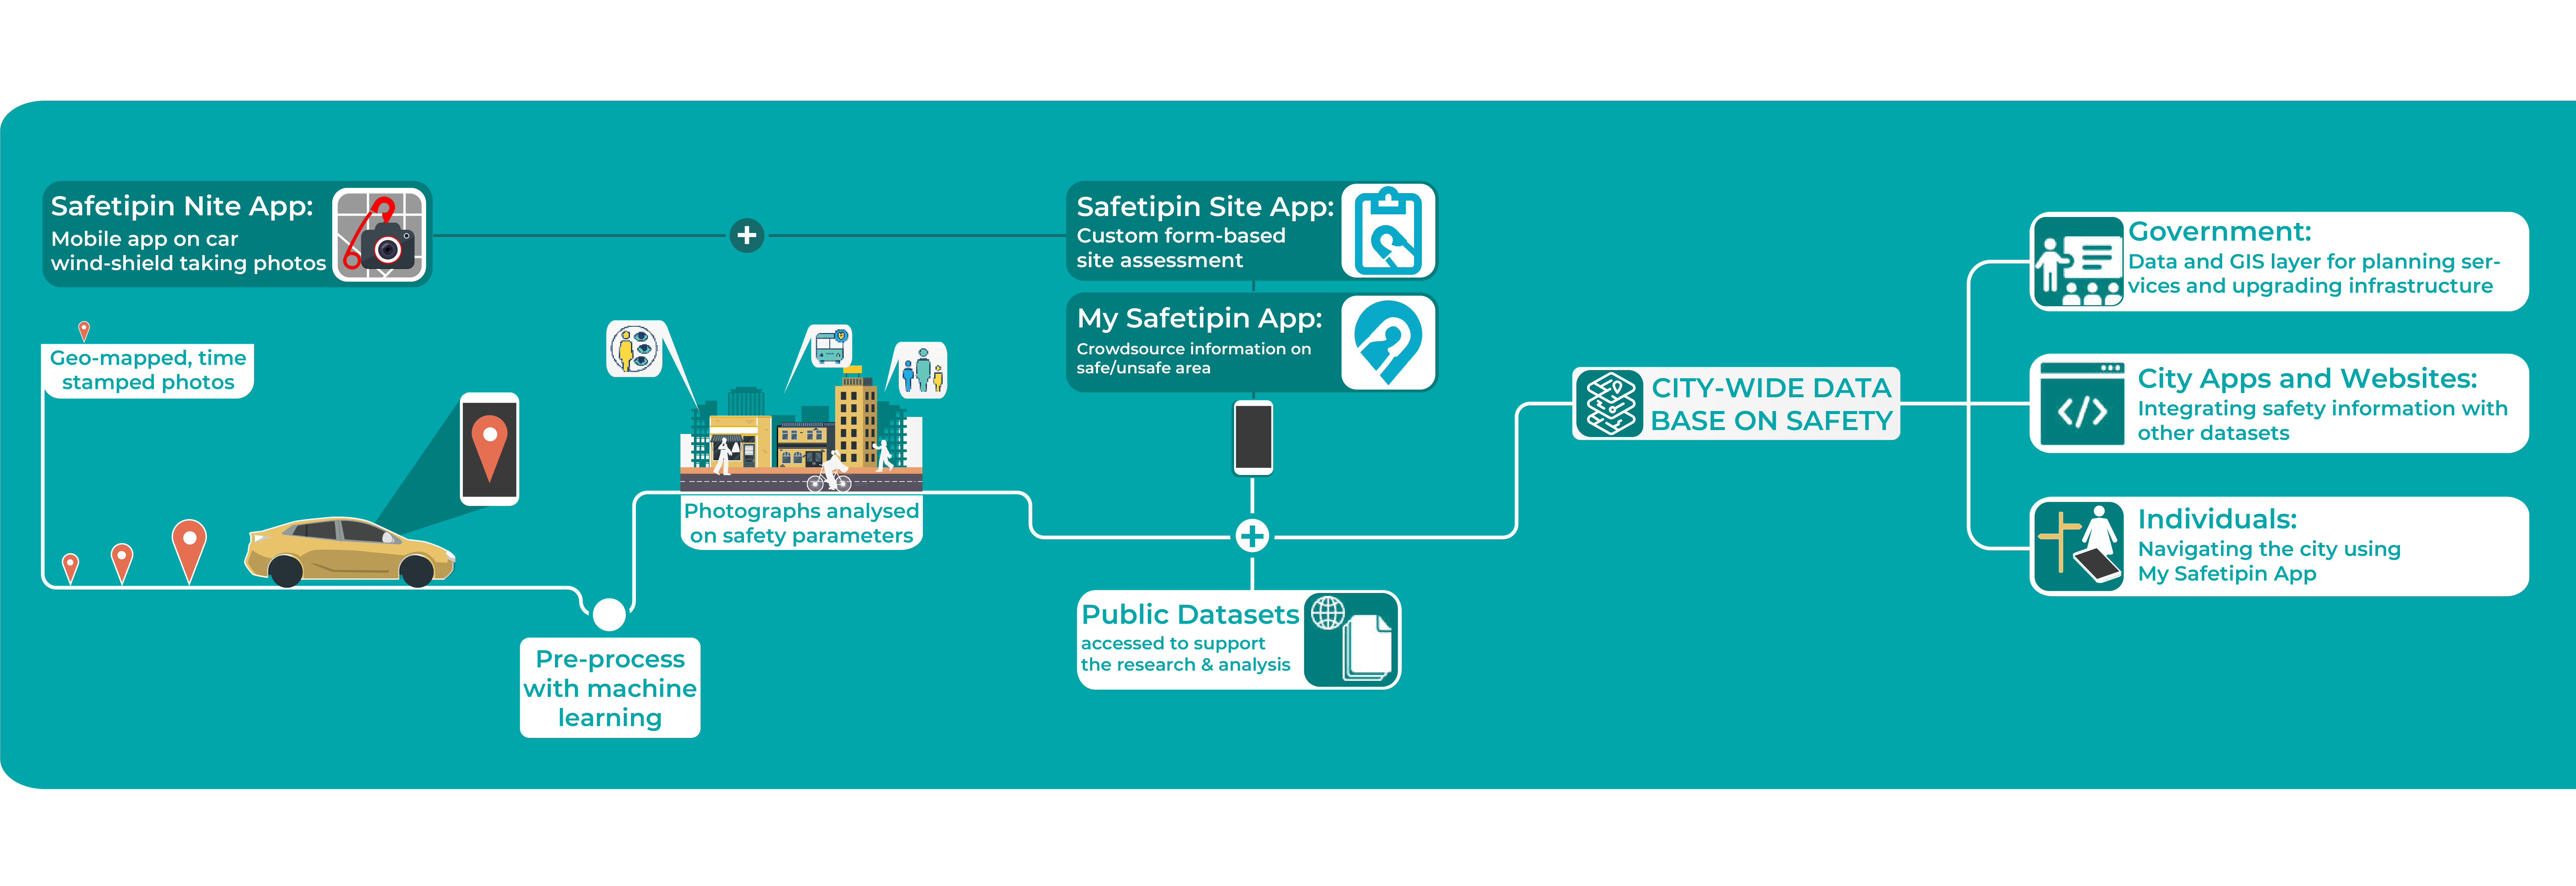
Our methodology is based on multiple methods for data collection, processing and presentation of information for decision making
Crowdsourcing and Decision Making through the MySafetipin app
The MySafetipin app is available for free download on Apple and Android phones. Users can give feedback about how safe they feel. They can also audit the place where they are and take pictures to support their audit.
The MySafetipin app also helps users take safer decisions in their lives. We use the data provided through all our sources to compute a safety score for a location. We then use this information (along with other data) to help people make safer choices through:
- Selecting a place to stay based on the safety score of the neighbourhood
- Driving or walking using the safest route
- Finding the nearest safe place and heading there
- Asking a friend to track them and get notifications if there is a problem
- Receiving notifications when in an unsafe place
Collecting project-specific data using the Safetipin Site app
Improving safety in urban spaces is also linked to usability of spaces. Governments are increasingly concerned about walkability, accessibility and functionality of public spaces. The Safetipin Site app can be customized for each project to collect additional information required by governments. This could involve accessibility of bus stops, functionality of public toilets, last mile connectivity from metro stations and so on.
Safetipin Nite is used by trained associates who visit the locations defined in the project, take pictures and complete a custom form that allows a wide range of data types, from multiple choice to descriptions. This information is geo and time tagged, and uploaded into our servers for processing.
Collecting and processing (coding) city-wide data using the Safetipin Nite app
Safetipin NIte is a scalable approach to collecting data both at night and during the day. A phone with the app is mounted on the windshield of a car. Routes are worked out at the back end by trained professionals so that all streets of the city are covered. The driver sees the route they need to take. As the car moves, photographs are taken at predefined distances and are uploaded onto our servers.
We run machine learning (computer vision) algorithms on these pictures to extract information on safety parameters. A few additional data points are then added by trained coders who use this information to audit a point. This forms the primary data source for safety parameters in a city.
The backend system used to codify audit points can be tailored to capture additional project based information. The system is available to all project stakeholders and allows for multiple level of credentials to allow for both participation and security.
Enhancing information using data from other sources (map-based)
Many governments today have GIS applications and have access to data layers on a wide variety of parameters. Safetipin data is also geo-tagged and can be combined with data from other map layers to enhance decision-making.
Simple applications can overlay jurisdictions on safety data, for example municipal ward boundaries, or police station coverage areas. It can be combined with traffic data to identify places where usage would improve with better infrastructure. Safetipin information can be combined with tourist spots to improve tourist footfalls.
Output as .csv files and on maps
All data captured and codified is available for analysis and representation on maps. The Safetipin environment has a provision to select sections of data based on areas on maps (shape files), date time filters, and filters on all data parameters.
Once the data is selected it can be exported as a comma separated value file, so that analysis can be done on Excel or a similar engine. The output can also be displayed on a map. Hence it is possible to provide a city with data about their dark spots to allow them to put up street lights, or to display places where the crowd parameter is high but the safety score is low, so they can deploy police vans to those areas.
Researchers and partners use data in these forms for their analysis.
Analysis and Reports
At the start of every project, Safetipin works with stakeholders to define the specific outcomes they want, and then defines the outputs from the assignment. Our urban planners then design the project so that the appropriate data is captured. Once the data collection is completed, we build custom maps and apply different visualizing techniques, so that the conclusions are actionable and presented in a way that all stakeholders can understand and use.
In most cases, the project ends with a final report that has a clear set of recommendations for cities to implement.
Urban Models and Dashboards
For cities that want to continue to act on Safetipin data beyond the duration of the project, we now provide a GIS environment with our data. This is presently based on QGIS and can be implemented either on the cloud or within the firewall of the concerned government. This allows the government to view the data dynamically and we make custom visualizations to display data for each point. They are also able to update data in places where they have made changes happen.
In specific cases, we can work with both ours and other data sources to create dynamic models to help government take specific decisions. Hence if a government were to want to add a bus stop based on presence of people and distance from another bus-step, that can be modelled. A user can simply ask the system to display where the next 5 bus stops should be, or compute a transport index if needed.
Along with models, Safetipin builds dashboards for governments. Dashboards show summary information, exceptions, trends and various charts and graphs to show progress of improvement initiatives. Again these dashboards can be customized as needed.